Nutrition
Compare Foods
Put two foods side by side; see their calorie, macro and micro differences visually and learn which to choose when.
- 549
- foods in the library
- 4
- ready-made comparisons
Measure
Macro breakdown
Where Does the Energy Come From?
Each gram of protein and carbohydrate counts as 4 kcal and each gram of fat as 9 kcal; the shares come from this approximate calculation.
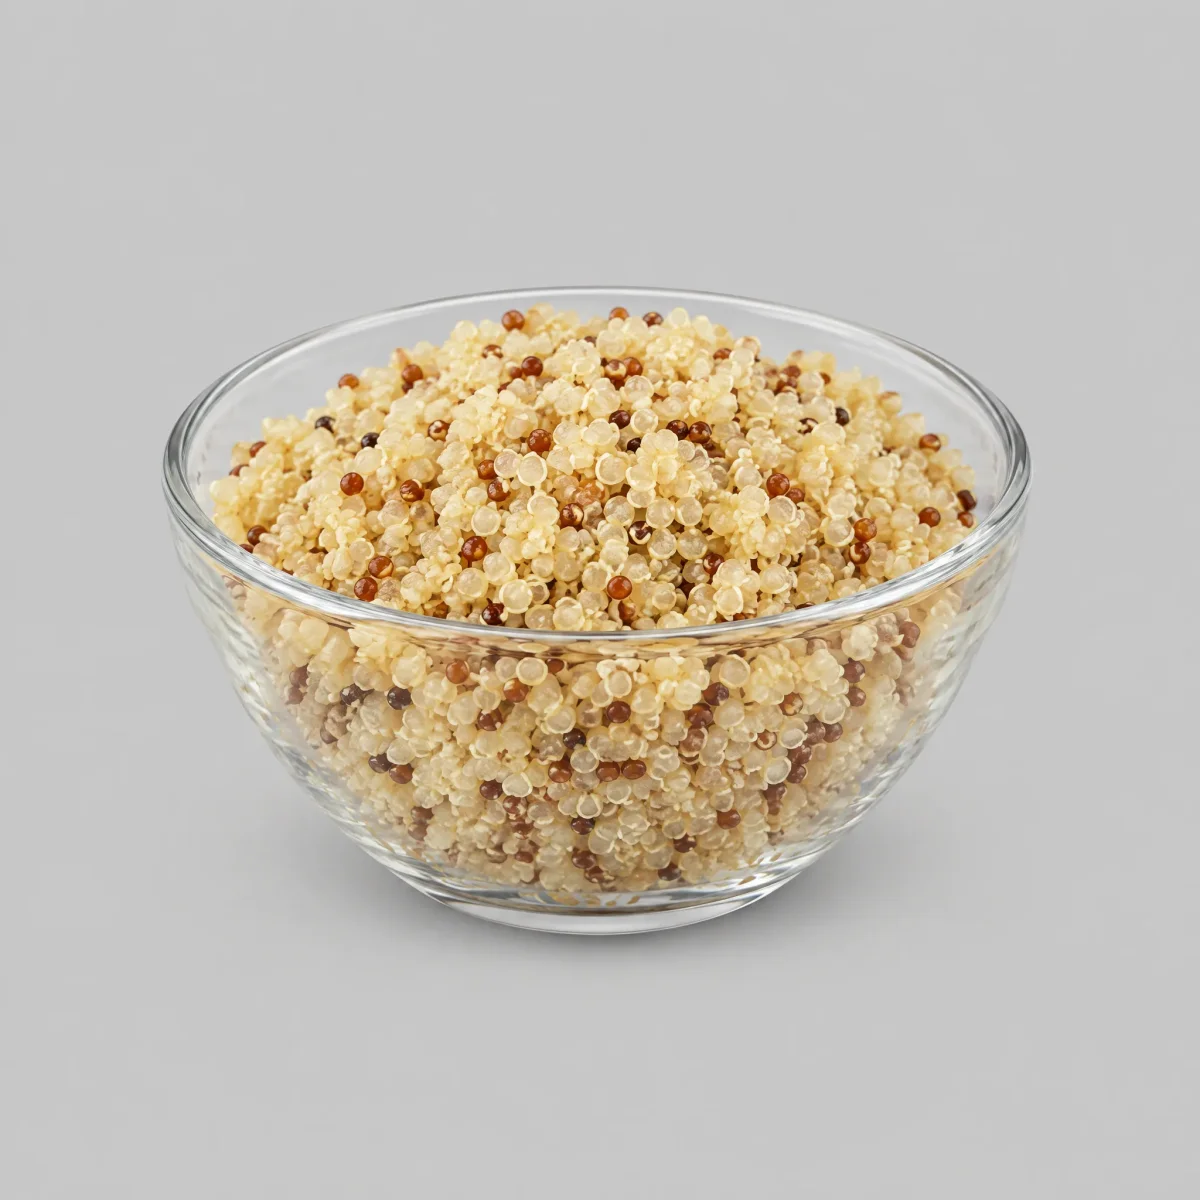
Quinoa
per 100 g
- Protein
- 4.4 g%15
- Carbohydrate
- 21.3 g%71
- Fat
- 1.9 g%14
- Fibre
- 2.8 g
Rice Pilaf
per 100 g
- Protein
- 2.7 g%9
- Carbohydrate
- 28.2 g%89
- Fat
- 0.3 g%2
- Fibre
- 0.4 g
Values Side by Side
In each row the longer bar is the food with the higher value.
QuinoaRice Pilaf
Calories120 kcal
130 kcal
Protein4.4 g
2.7 g
Total fat1.9 g
0.3 g
Carbohydrate21.3 g
28.2 g
Fibre2.8 g
0.4 g
Standout differences
What Sets Them Apart
The clearest differences when compared on the same measure.
Quinoa
Higher in fibre
7 times more
Quinoa2.8 g
Rice Pilaf0.4 g
Quinoa
Higher in protein
64% more
Quinoa4.4 g
Rice Pilaf2.7 g
Detailed table
All Values
Every recorded value, vitamins and minerals included. A value with no record is left blank, not estimated.
Nutritional Values
Compared per 100 g.
| Nutrient | Quinoa | Rice Pilaf | Ahead |
|---|---|---|---|
| Calories | 120 kcal | 130 kcal | – |
| Protein | 4.4 g | 2.7 g | Quinoa |
| Total fat | 1.9 g | 0.3 g | – |
| Carbohydrate (including fibre) | 21.3 g | 28.2 g | – |
| Fibre | 2.8 g | 0.4 g | Quinoa |
Choice guide
Which One Should You Choose, and When?
Derived by rules from the differences in the table. Talk to your dietitian about your own situation.
Choose Quinoa
- When you want to raise the protein in your meal
- When you want to stay full longer and meet your fibre target
Badges and suggestions are derived by rules from the recorded values in the table. A value with no record is not ranked and not estimated.
Both values are for the cooked product. If you compare by dry weight, the result changes.
Nutrients with no data in either record: Iron, Calcium, Magnesium, Potassium, Sodium, Zinc, Phosphorus, Vitamin A, Vitamin C, Vitamin D, Vitamin B12, Folate, Cholesterol.
Ready-made pairs
Ready-Made Comparisons
The pairs people ask about most.
The content on this page is for general information only; it does not replace medical diagnosis or treatment. A personalised nutrition plan can only be prepared by a licensed dietitian. If pregnancy, a chronic condition, regular medication use, child nutrition or a clinical condition applies, a doctor and dietitian check is required before starting a plan.
Scientific Sources →